PathwayBuilder™
 

VISUALIZATION


MAIN MENU


The signaling network visualization tool for TRANSPATH®, the PathwayBuilder™, provides two different interfaces for creating specific views of the data. The Main Menu is a general interface that allows access to the functions of the program in an uncomplicated manner. The Expert Menu enables the user to select parameter settings manually and influence the visualization results in detail.

Scope

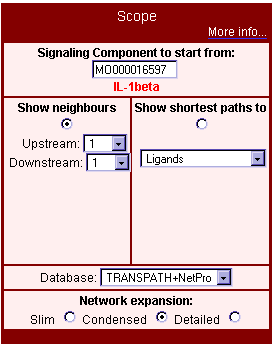
Selecting the scope of visualization with the Main Menu offers two main methods of application (Fig. 1). There is either the opportunity (show neighbours) to search and view all nodes (molecules, genes, and reactions) within an adjustable radius around the starting signaling component, or queries can be started for shortest paths to definable target nodes, which can be important biological groups (such as receptors, transcription factors, or genes), saved results of queries (e.g. microarray data sets) with the TRANSPATH search engine, or matches for free-text search terms.

Fig. 1: Selecting the scope of visualization with the main menu of the PathwayBuilder™ interface
With the upstream and downstream parameters in the show neighbours section, the radius of the visualized neighbourhood regarding direction and distance, i.e. the number of steps upstream and/or downstream of the starting node, can be determined. One step is defined as the distance from one component to the next connected component of the same type (molecule or reaction). For example, if you start from a reaction downstream with a distance setting '1', the signal flow map will show you the starting point reaction, the signal acceptor molecule(s)/gene(s), and reactions extending from this molecule(s)/gene(s). Indirect reactions will consume 3 steps, this means to see indirect reactions going out from a molecule you have to set the downstream distance to at least '3'.
The shortest path function is implemented to find the most direct connections to defined groups of molecules/genes. For example, to find the shortest path between IL-1beta (interleukin 1 beta) and IKK (inhibitor of kappaB kinase) molecules, select 'customized', 'name, synonyms' as field, 'molecule' as table and enter 'IKK' as target. If the target is outside of the standard radius settings (3 steps 'up', 3 steps 'down'), you can manually increase the search distance directly in the map (Fig. 4). Detected targets are depicted in blue-grey (Fig. 2: Shortest path from IL-beta to IKK molecules). To find the shortest connections to prominent functional groups of components such as transcription factors, simply select the group name (Fig. 3: Shortest paths from IL-1beta to transcription factors).
Table 1: The Expert Menu parameter settings that are used as standard settings in the Main Menu's network expansion levels 'Slim', 'Condensed', and 'Detailed'
  Main Menu
Expert Menu parameters Slim Condensed Detailed
Include subfamilies 0 1 1
Show unmodified form off off on
Show bordering entries off off on
Condense basic molecules off on off
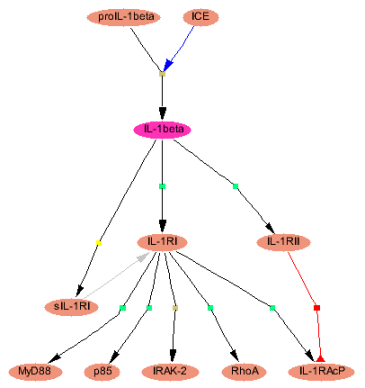
The network expansion parameter with its three levels 'slim', 'condensed', and 'detailed' influences the number of connections that are shown. 'Slim' shows a network that stays on the hierarchical level of the starting component (Fig. 4) – reactions connected to superfamily or subfamily molecules are not taken into account. This selection is best for creating an overview. 'Condensed' allows the viewing of all reactions linked to basic molecules subsumed to their corresponding orthogroup entries. This option is most useful when starting with an orthogroup molecule. 'Detailed' shows a complex network including reactions linked to entries one hierarchical family level below and also follows the modified form links in reverse direction. Table 1 shows the corresponding parameter settings in the expert menu for the three levels of network expansion.
       

Fig. 4: Left: Signal flow map showing the near IL-1beta signaling vicinity with 'slim' selected for the network expansion. Above left: the number of steps upstream and downstream can be altered directly in the map. Above right: directly modify the map by expanding or deleting single arbitrary nodes.

An explanation for the meaning of symbols and colours is given in the legend.

It is possible to modify maps in an interactive way (Fig. 4). A menu appears when left-clicking on a specific node (molecule, gene, or reaction). You can select to delete this node or to expand the map with network information for this node. Delete erases only this one node from the map. Neighboring nodes are still present with fragmentary connections. Expand adds automatically the signaling neighborhood of the selected item to the existing map (please note that the program uses the settings that were selected for the last visualization). You can also open the main menu or expert interface to modify the visualization (e.g. expansion and detail) of the network that will be added. Please note that this functionality needs a browser with enabled javascript.
All molecules from a network visualization can be transferred to a search result list, which can be used for further analysis and visualization purposes, by clicking on the 'Take molecules as search result' link.

Fig. 5: Signal flow map of the upper IL-1beta pathway with 'condensed' network expansion. The recursive grey arrows attached to some molecules indicate that for these entries, basic molecules are subsumed. All reactions that are linked to the subsumed basic molecules are shown to lead to and extend from the respective orthogroup level molecule.

Fig. 6: IL-1beta network with network expansion 'detailed' selected. Small symbols are used to make the map suitable for screen size. The name of the component appears when the mouse pointer is over the symbol.

back to the top   next


Style

The PathwayBuilder™ provides four different modes for visualizing TRANSPATH data. The molecules and their interlinking reactions in the signaling networks can be viewed as Signal Flow Map, Clustered Map or as a List output. All objects and names in the representations are hyperlinked to retrieve the respective single entries from the database (please note that the database entry appears on a different browser window, which may be behind the output window).
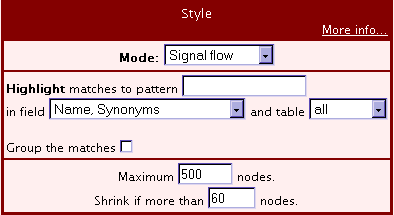
Choose the limiting number of entries to be displayed in the network with maximum ... nodes (Fig. 7). If a map contains a designated number of components (set the limit with shrink more than ... nodes), smaller symbols are used to enhance the visibility and to avoid too much scrolling. The name of the component appears when the mouse pointer is over the symbol.

If you want to highlight nodes, use the highlight matches to pattern option. Enter a search pattern and choose the corresponding field and table. By selecting the group the matches option you can cluster all matches in a frame.

Fig. 7: Style section of the main menu PathwayBuilder™ interface.
Highlighted objects will appear in light blue (Fig. 8: Signaling downstream of Oncostatin M as a clustered map output with highlighted field 'name, synonyms=OSM' and table 'molecule'). Highlighting of certain saved search results (from search engine) is possible now, also in saved maps.
The visualization mode 'Clustered Map' shows maps of signaling networks in a more compact, radial shape, thus enhancing the visibility for some searches. The symbols and colours used are the same as in 'Signal Flow'.

back to the top   next


Map Management

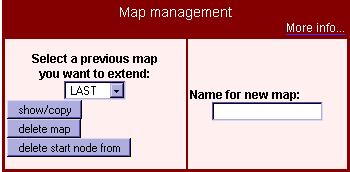
This interface section provides an opportunity to save visualization results (for modes 'signal flow' and 'clustered map'). To save a map, enter a name and execute the visualization. When returning to the main menu via the link in the map (please do not use the back button of your browser), the saved map can be selected from the list on the left.

Applying the map extension adds the result of your current search to the chosen saved map. By selecting 'LAST' the latest visualization result is used.

Fig. 9: Map management – saving and extending visualization results.

back to the top   next


EXPERT MENU

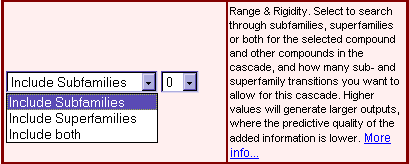
The expert interface enables the user to manipulate parameter settings to create very specific visualization results. If you have started in the main menu and want to refine your query in the expert mode, the latest parameter settings are adopted. The options range and rigidity enable you to view hierarchical information for molecules and to follow signaling on other hierarchical levels (Fig. 10).

Fig. 10: Follow pathways on different hierarchical levels with the options 'range' and 'rigidity'.
Possible values for range are include subfamilies, include superfamilies, and include both. 'Include subfamilies' will display all molecules that are "below" in the hierarchy to the molecules connected via reactions to the selected component. 'Include superfamilies' does the same for all molecules "above". As signaling information is often given at different hierarchical levels, these options are often necessary to obtain complete pathways. The parameter 'rigidity' restricts the number of hierarchical levels that are shown. The standard setting 'rigid' allows no hierarchical view.
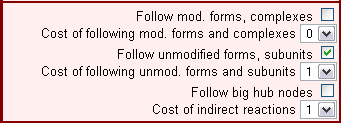
Switching on follow modified forms/complexes will also display all states/modified forms such as phosphorylations and all complexes of the molecules. If you are starting from a modified form, activate follow unmodified form to view the signaling taking place there. Costs can be assigned for the visualization of modified form/complex and unmodified form/subunit links and indirect reactions. If indirect reactions have the cost '3' assigned, they will be displayed only if the number of selected downstream or upstream steps is at least '3'. For indirect reactions, the cost is set to 1 by default. If coming from ArrayAnalyzer ('show_full_pathway'), it is automatically set to 3 according to the ArrayAnalyzer's treatment of indirect reactions.

Fig. 11: Follow links to modified forms, complexes, and big hub nodes such as small molecules (ATP etc.) or general families.
Normally the search doesn't follow all the links from small molecules such as ATP or very general family entries such as 'transcription factors'. Selecting follow big hub nodes (Fig.11) will change that.

back to the top   next

The condense basic molecules to existing orthogroup molecules option subsumes all homologue basic molecule nodes and hides them behind the corresponding orthogroup molecule node. All their connected reactions can now be followed from the orthogroup molecule. Orthogroup nodes with subsumed basic nodes can be identified in the visualization by recursive arrows. This option is only available for the visualization modes 'Signal Flow' and 'Clustered Map' and is used best by starting the visualization from an orthogroup molecule node.

Fig. 12: Condense basic molecules to orthogorup entries
Reactions with the new type decomposition are solely linked to pathway step reactions and are strictly excluded from traversals. They are traversed and shown just additionally after a certain search is completed if the option Show reaction decompositions in the Style section is enabled. In Signal Flow Style, the corresponding networks are incorporated as small static subnetworks and are graphically tied to the reaction they are decomposing. In List output they appear as separated clusters of lines and in Clustered Style output they appear as separate networks.
Decompositions explain the mechanism and identify the acting molecules of reactions that occur in complexes.
The switch show bordering entries enables the visualization of so-called fringe nodes. These nodes border the traversal and can complete the network information. Some of these nodes are not reachable in a certain direction, but carry valuable information such as enzymes in mechanistic reactions from a downstream perspective.

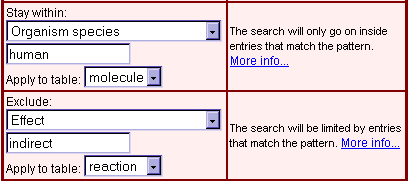
Fig. 13:
Filter can be applied to include only those nodes that match a specific search pattern (Stay within). The search pattern is used in combination with field and table names. Nodes that you do not want to appear in the visualization can be excluded in a similar way. A second 'Exclude' filter is available for refining exclusions.

back to the top   next

List visualization mode

The List representation is line-based. Every line represents another path. As for the other visualization modes, restrictions concerning direction and distance can be set or shortest paths to defined targets can be displayed (Fig. 14).

Fig. 14: List representation of shortest paths leading from IL-1beta to transcription factors.
By checking Show also reactions in the style section, reactions are included in the paths (Fig. 15). This is useful, when you have a bi-directional search to discriminate between upstream and downstream paths.

Fig. 15: List representation with reactions included.

back to the top