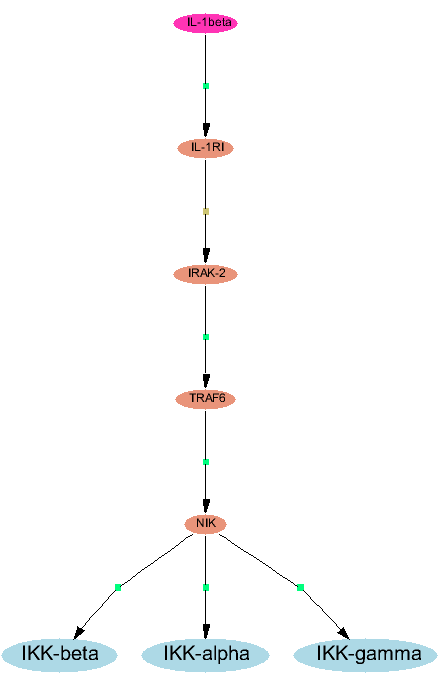
Fig. 2: Shortest path from IL-beta to IKK molecules

Fig. 3: Shortest paths from IL-1beta to transcription factors
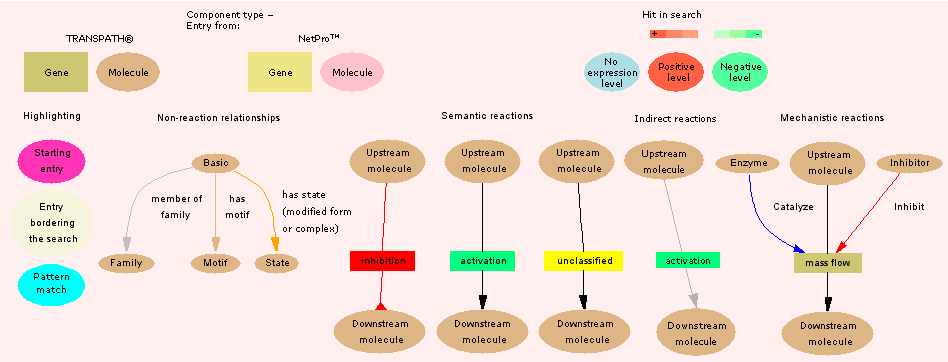
Map Legend: Molecules are shown as round shapes, genes as large rectangles, and reactions are symbolized by a rectangle in an arrow. The different colours visualize distinct types and functions. The green, red and yellow rectangles, for example, symbolize semantic reactions, whereas the olive-colored symbol is for mechanistic reactions.
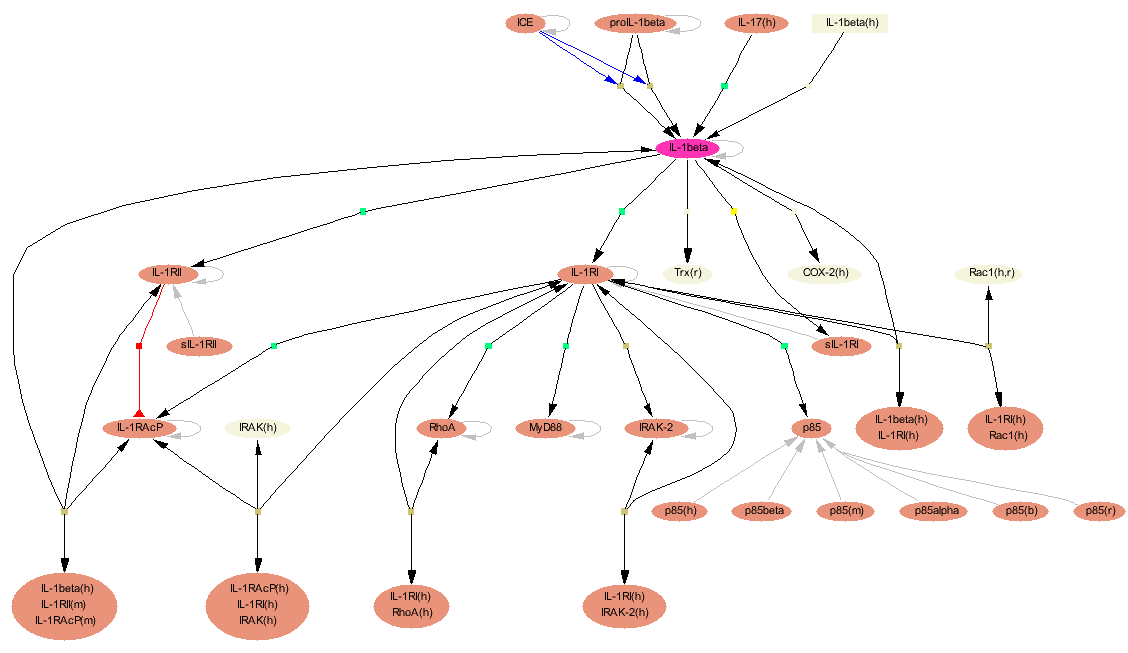
Fig. 5: Signal flow map of the upper IL-1beta pathway with 'condensed' network expansion. The recursive grey arrows attached to some molecules indicate that for these entries basic molecules are subsumed. All reactions that are linked to the subsumed basic molecules are shown to lead to and go out from the respective orthogroup level molecule.
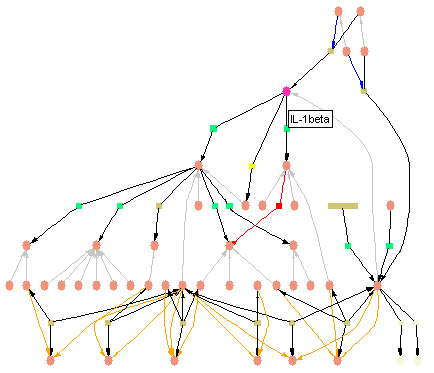
Fig. 6: IL-1beta network with network expansion 'detailed' selected. Small symboles are used to make the map suitable for screen size. The name of the component appears when the mouse pointer is over the symbol.
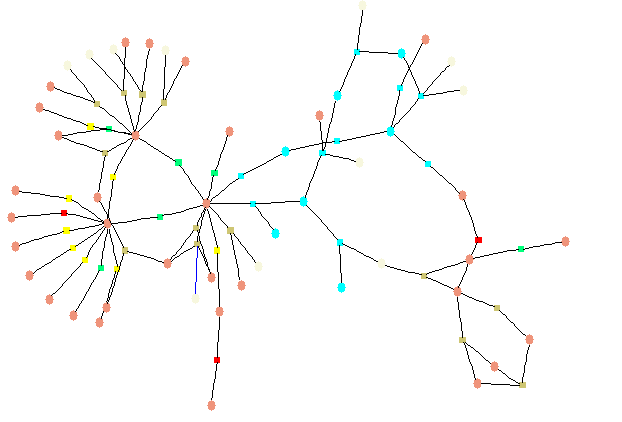
Fig. 8: Signaling downstream of Oncostatin M as a clustered map output with highlighted field 'name, synonyms=OSM' and table 'molecule'