Identification of key entities (pathways, molecules, genes, ontology terms) with the ArrayAnalyer™ and TRANSPATH®
TRANSPATH® Professional and the integrated tool ArrayAnalyzer™ provide the capability to search with lists of data, e.g. unique gene/molecule identifiers from Affymetrix, Entrez Gene, Swiss-Prot etc., with attached expression levels from gene expression array experiments. The result set can be analyzed for common molecules or genes in the immediate or distant vicinity of the signaling network (Key node analysis). For the hits, maps can be generated with the PathwayBuilder™ to visualize pathways and crosstalk between them. Another possibility is to perform a Functional group analysis using ontologies (Gene Ontology (GO), Cytomer™).
The search interface for the ArrayAnalyzer™ can be opened from the menu on the left. You can match your data with the contents of either the molecule or the gene table from TRANSPATH®. The search engine uses indices for nine types of gene identifiers (Table 1), which makes the query extremely fast. A data set list should contain one ID per line. One or more expression level values can be attached to the pure identifier behind a separator, which can be a tab or another character (default setting is the pipe symbol |). Choose the type of separator with the check boxes above the search term field. An example list inserted into the ArrayAnalyzer™ interface can be seen in Fig.1. In addition, text files containing query lists in the required format can be uploaded. Instead of querying with new data, a previously saved query can be viewed and used as ArrayAnalyzer™ input list.
Table 1: Applicable Gene/Molecule identifiers and the required formats
| Search Field | Format | Example |
|---|---|---|
| Affymetrix | Probe set ID | 41657_at |
| EMBL/Genbank/DDBJ | Acc. No. | U15637 |
| Ensembl | Gene ID | ENSG00000118046 |
| HGNC | Approved gene symbol | STK11 |
| Entrez Gene | GeneID | 5966 |
| MGI | Approved gene symbol | Arnt |
| RGD | Approved gene symbol | Arha2 |
| SWISSPROT/SPTREMBL (molecule only) | Acc. No. | P53350 |
| TRANSPATH | Acc. No. | MO000022389, G009345 |
| UniGene | Cluster ID | Hs.279920 |
Another possibility for obtaining input lists are 'normal' queries with the molecule or gene table search engines. Above each results list is a link that transfers the data to an input list.
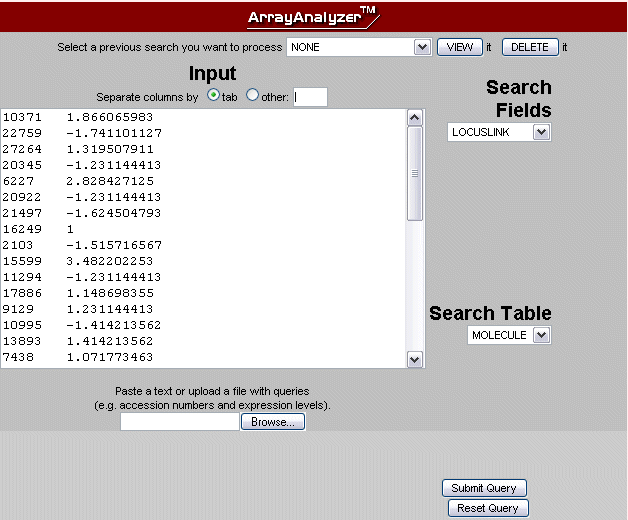
Fig.1 Search engine interface with a sample data list
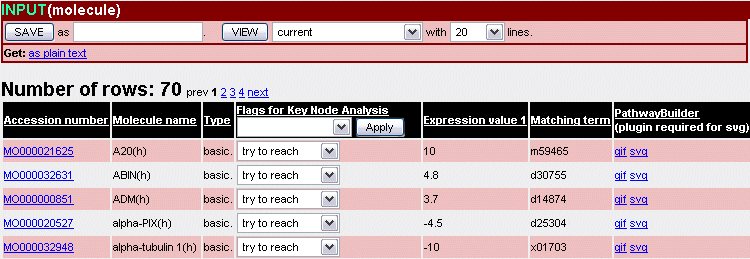
Fig.2 Search result: Input list for the ArrayAnalyzer™
- Key node analysis - find key regulatory nodes in a common network
- Functional group analysis - map your molecules to ontology terms from GO (molecular function, biological process, cellular component) or Cytomer™ (organs, tissues, cell types) or identify involved canonical TRANSPATH® pathways
Key node analysis
By default, all entries of an input list are included in the respective analysis and are labeled as 'try to reach'. For refining the analysis, a target entry can be marked as 'must not reach'. All nodes that can reach this target within the distance will be excluded from the analysis. This often has a strong restrictive effect, whereas 'ignore' excludes only the target entry itself. Changes to the flag settings must always be submitted with the Apply button (even one line changes) (Fig.2).
For the Key node analysis, three parameters can be set.

Fig.3 Key node options
Distance (Fig.3) determines the maximum number of steps ('molecule -> reaction -> molecule' counts as one step) between molecules in the analysis. Thus it defines the search radius around each molecule (or gene) of the results list.
Using the network pull-down list, you can select the general pathway orientation (up- or downstream) and whether you want to follow only the reactions (including or excluding gene expression reactions) that are connected with the entries from your set in the analysis, or whether links to superfamilies, modified forms or complexes are included. The distance between a molecule and its superfamily, modified form or complex is considered to be zero, which means the selected maximum distance to key nodes is not reduced by these connections. Selecting superfamilies, modified forms or complexes increases the chance of finding connections to other nodes.
Indirect reactions are included with edge cost 3 (equivalent to 3 one-step reactions).
With the penalty value, the significance score of key molecules with connections to molecules other than in the initial set can be decreased. As a result, those key nodes that are linked mainly to molecules of the initial set become more prominent. This is useful if key molecules with generally high reachability are returned too often.
All key nodes (either molecule or gene) in the analysis results list will be ordered by default due to their significance score. This score reflects the relation of connected relevant nodes (i.e. the nodes that correspond to the molecule/gene list from the initial query) to nonrelevant nodes (i.e. molecules/genes that can be reached from the key node but are not in the initial list):
significance score (N, M),
where
significance score = kN/(k+M),
k = 2(20-p) with p = penalty value (1..20),
N = number of reached relevant nodes (if weighted Score
selected, then it is the sum of the absolute magnitudes of the levels from
the reached nodes),
M = number of reached nonrelevant nodes
Expression level values, that have been attached to a molecule/gene list, can optionally have an influence on the score (weighted score) and thus on the ranking of identified key nodes. Positive and negative expression values are normalized and the weight increases with the value.
'Small molecules' such as ATP or ADP are excluded from the analysis by default.
As an example, if you choose direction 'upstream' and a maximum distance of '5', you will get as a result the most significant upstream molecules that can reach the largest number of molecules from your data set within the maximally allowed number of steps (5).
Redundant key nodes are removed from a result list (example : A->B->(C,D,E) cases are skipped, only B->(C,D,E) is kept). Please note, that in some rare cases A->B->(C,D,E) is not removed. In such cases, there is another key node directly below A, but its targets exceed the radius if starting from A, preventing it from being displayed in the map. Therefore these cases are not really redundant and are not removed, although they seem redundant on the map. The algorithm counts the number of directly linked other keynodes of A. Only if the number is 1 (e.g. only the B node), then A is removed.
The analysis result is displayed as an output list of molecules/genes with three new attributes: the score (significance) of the entry, the N value (#hits in network) and number of non-relevant reachable nodes (M). (see above and Fig.4).

Fig.4 Key node analysis result
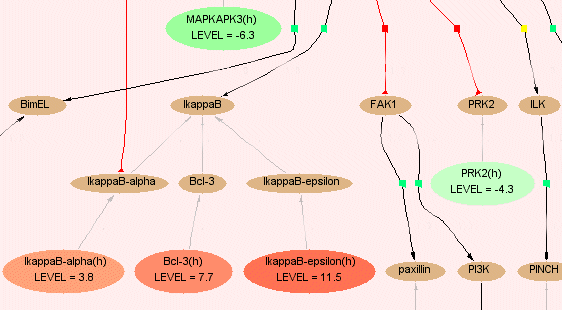
Fig.5 Map with highlighted matched molecules and different expression levels
Network cluster analysis
The cluster analysis can be used to identify common subnetworks for a given molecule/gene list. The algorithm tries to connect each pair of the individual list items. The cluster separation degree influences to which degree clusters are separated/divided and thus the cluster size. The higher the degree, the more edges are removed. The edges are assigned a betweenness value, and edges with high value are more likely to be removed. Too low degrees yield one big cluster which is also difficult to visualize. Too high degrees can leave the input set unclustered. The size of the given input list also influences this parameter: big inputs usually require higher separation degrees.
NetPro data (if licensed) are not included in the analysis.

Fig.6 Network cluster analysis options
Functional group analysis
This analysis function allows molecules from the input list to be clustered according to common associated ontology terms or appearance in canonical TRANSPATH® pathways.
By selecting the parameters max. p-value and min. n-list, the user can restrict the output to the cases which are characterized by a low p-value (e.g. < 0.001) and can be considered as statistically significant (though, for such conclusions the multiple testing correction should be taken into account), and/or the cases that are characterized by a high number of hits.

Fig.7 Functional group analysis against several ontologies
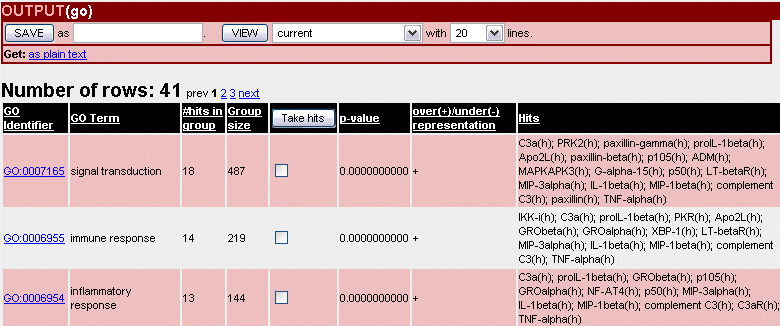
Fig.8 Gene Ontology output list
- Organ/Tissue - the groups are different organs or tissues of the human organism. Here, K is calculated as the number of human molecules from TRANSPATH whose genes are expressed in the given tissue according to the UniGene EST frequency calculations (see TRANSPATH® Report 2, 0001 (2004)).
- Disease (human) - the groups are human diseases from the Proteome HumanPSD database. Here, K is calculated as the number of human molecules from TRANSPATH that is associated with a disease either as a therapeutic target or as a diagnostic marker (indicated in the role column).
- GO (Gene Ontology) - the groups are different categories given in three ontologies. Here, K is calculated as the number of human, mouse and rat molecules from TRANSPATH whose genes are linked through Entrez Gene to the corresponding GO term. The GO term is shown in the column "Term".
- Transpath Pathways - the groups are different pathways and chains from TRANSPATH. Here, K is calculated as the number of orthofamily/orthogroup/orthobasic entries involved in the corresponding pathway or chain.
The p-value is the probability of getting the observed number of hits in a group just by random chance. Two values are calculated for overrepresentation p-value (+) and for underrepresentation p-value (-). The p-value is calculated using Binomial distribution using the following formulas:
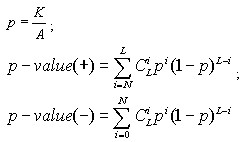
The size of the list of matching molecules (L) is the number of molecules from the input list that matched. All molecules (A) is the number of molecules in all groups together. It is calculated separately for each analysis mode.