FINDING KEY MOLECULES OR GENES FOR EXPRESSION ARRAY DATA WITH TRANSPATH®
TRANSPATH® Professional provides the capability to search with lists of data, e.g. respective SWISS-PROT accession numbers, EMBL/GenBank/DDBJ accession numbers, or Affymetrix array probe set IDs with attached expression levels from gene expression array experiments. The result set can be analyzed for common molecules or genes in the immediate or distant vicinity of the signaling network. For the hits, maps can be generated with the PathwayBuilderTM to visualize pathways and crosstalk between them.
The SWISS-PROT accession number is the recommended unique identifier for proteins to be used in array data analysis with TRANSPATH®. EMBL/Genbank/DDBJ accession numbers, Affymetrix array probe set IDs, LocusLink and Unigene accession numbers will work with both molecules and genes. An expression level value can be attached to the identifier behind a separator, designated by the pipe symbol '|'. An example list inserted into the TRANSPATH® Molecule search engine can be seen in Fig.1. In addition, text files containing query lists in the required format can be uploaded.
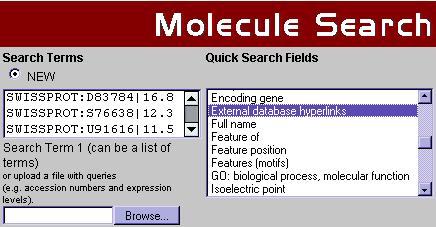
Fig.1 Part of TRANSPATH® search engine interface with a sample data list
Instead of making a new search you can use a previously saved query: click on 'ArrayAnalyzerTM' in the menu on the left and select between your saved searches. If there are none, you have to do a new query to be able to apply the ArrayAnalyzerTM.
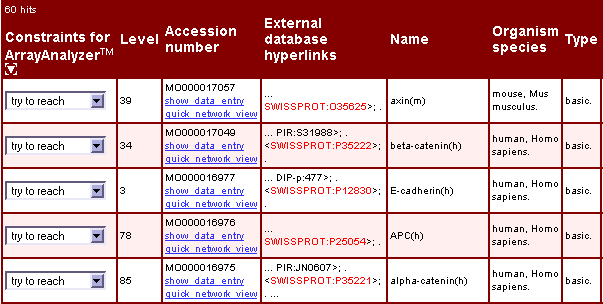
Fig.2 Search result: Molecule entries that match the input list
To find key nodes that are connected to your list of proteins or genes, an analysis can be run using the result set and the ArrayAnalyzerTM. By default, all entries of the list are included in the analysis and are labeled as 'try to reach'. For refining the analysis a target entry can be marked as 'must not reach'. All nodes that can reach this target within the distance will be excluded from the analysis. This has often a strong restrictive effect whereas 'ignore' excludes only the target entry itself.
There are four parameters which can be set. Select 'upstream' and/or 'downstream' for choosing the general direction(s) for the pathway orientation that will be analyzed (Fig.3). Using both directions in one analysis will slow down the performance.
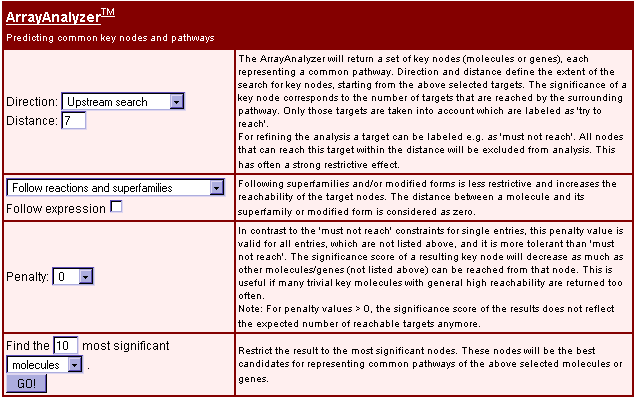
Fig.3 ArrayAnalyzerTM interface
Distance determines the maximum number of steps ('molecule -> reaction -> molecule' counts as one step) between molecules in the analysis. Thus it defines the search radius around each molecule (or gene) of the result list.
With the pull-down list in the middle of Fig.3, you can select whether you want to follow only the reactions that are connected with the entries from your set in the analysis, or whether links to superfamilies or modified forms are included. The distance between a molecule and its superfamily or modified form is considered as zero, thus the selected maximum distance to key nodes is not reduced by these connections. Selecting superfamilies or modified forms increases the chance to find connections to other nodes.
Gene expression reactions can be included by selecting the option. Within the joint Transpath+NetPro network, upstream analysis with Superfamilies and without expressions is possible. Indirect reactions are included with edge cost 3 (equivalent to 3 one-step-reactions).
All key nodes (either molecule or gene) in the analysis result list will be ordered due to their significance value. This value reflects the relation of connected relevant nodes (i.e. the nodes that correspond to the molecule/gene list from the initial query) to nonrelevant nodes (i.e. molecules/genes that can be reached from the key node but are not in the initial list): significance (N, M), where significance = kN/k+M, k = 2(20-p) with p = penalty value (1..20), N = number of reached relevant nodes, M = number of reached nonrelevant nodes
With the penalty value, the significance of key molecules with connections to molecules other than in the initial set can be decreased. As a result, those key nodes that are linked mainly to molecules of the initial set become more prominent. This is useful if key molecules with generally high reachability are returned too often.
You can narrow your analysis result list by focussing only on the most significant molecules or genes. This means that those molecules/genes with highest significance are displayed.
For example, if you choose direction 'up&down', the display of the five most significant molecules, and a maximum distance of '5', you will get in a result list five molecules that can reach the most molecules of your selection with the maximally allowed number of steps or less.
'Small molecules' such as ATP or ADP are excluded from the analysis by default.
The analysis result is displayed as a list of molecules/genes with one new attribute: a value for the significance of the entry (Fig.4). The value describes the number of entries from the molecule/gene set that can be reached from this entry with respect to the selected parameter settings. If you have chosen an up- & downstream-directed analysis the significance value is the sum of the values for the upstream analysis and the downstream analysis.
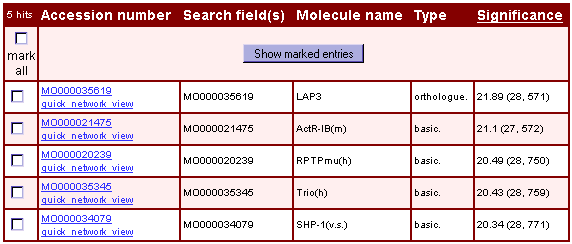
Fig.4 Result of an analysis of molecule clusters that are involved in TGFbeta signaling (molecule testset; parameter settings: direction = 'upstream', distance = '5', 'include direct reactions of superfamilies and modified forms', show '5' most significant molecules, penalty = '10')
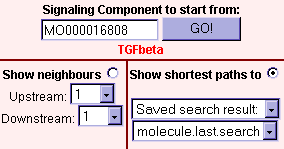
Fig.5 View connections to nodes of the array data set
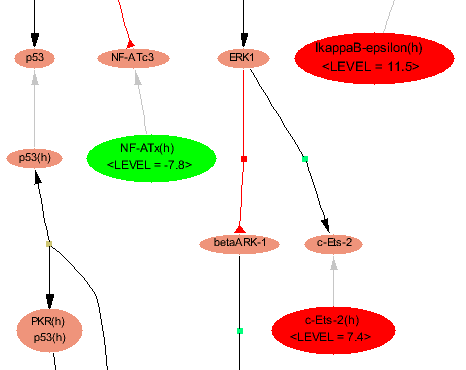
Fig.6 Map with highlighted matched molecule
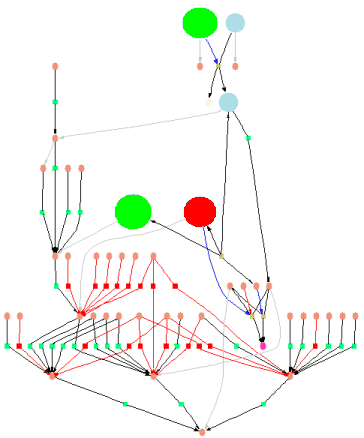
Fig.7 Map with shrunken molecule symbols - matches are highlighted